

PIVOT and UNPIVOT in SQL Server
-
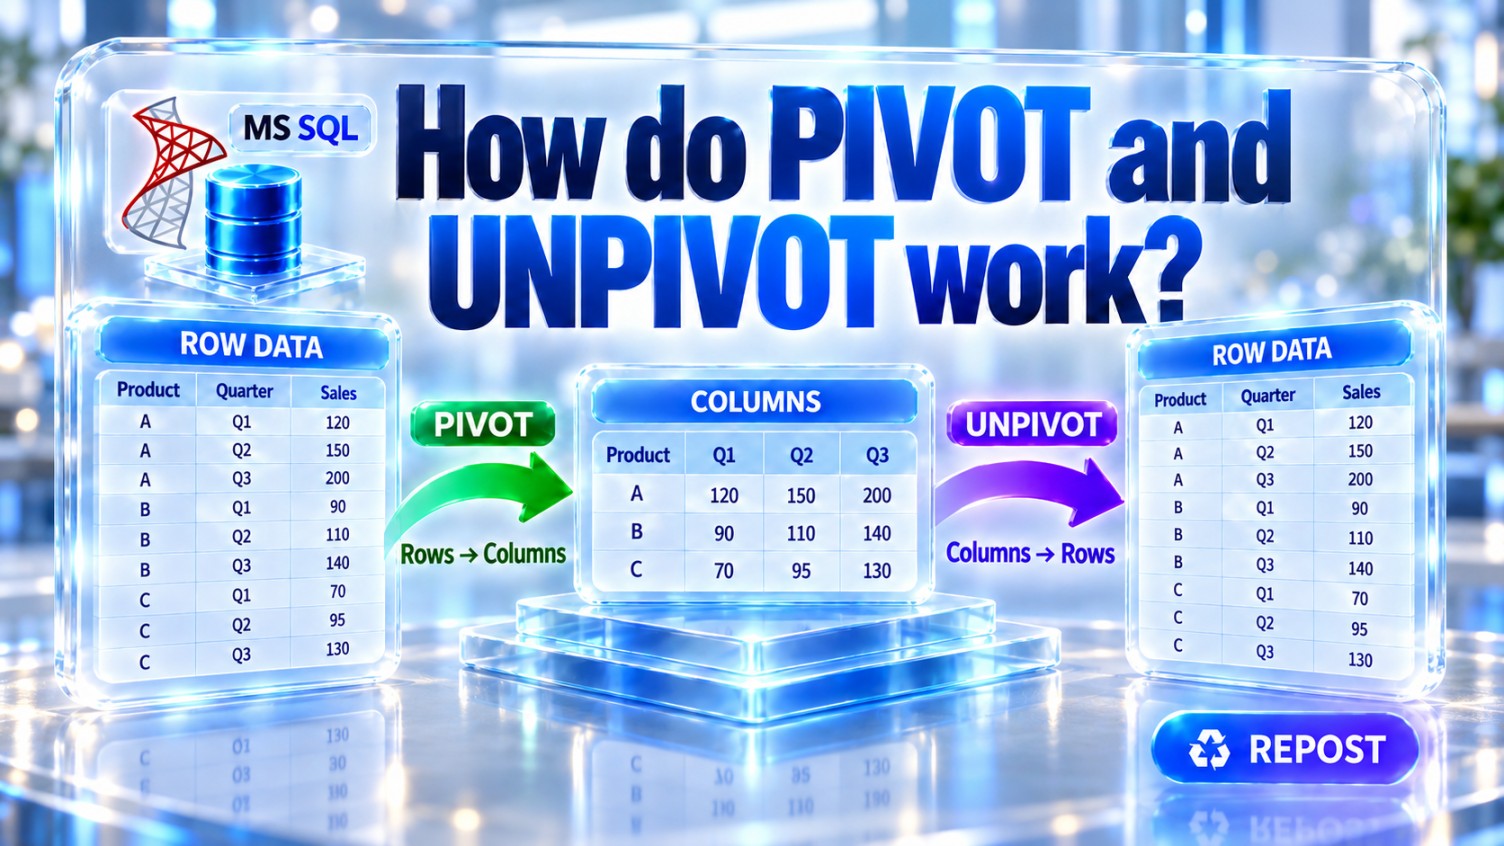
PIVOTconverts row values into columns. -
UNPIVOTconverts columns back into rows.
A simple way to remember:
PIVOT   : Rows → Columns
UNPIVOT : Columns → Rows
1. PIVOT
What is PIVOT?
PIVOT rotates unique values from one column into multiple output columns. It also applies an aggregate function such as:
-
SUM() -
COUNT() -
AVG() -
MIN() -
MAX()
It is commonly used to create summary and cross-tab reports.
Sample requirement
Suppose sales are stored like this:
| SalesPerson | SalesMonth | Amount |
|---|---|---|
| Arun | January | 10,000 |
| Arun | February | 12,000 |
| Arun | March | 15,000 |
| Bala | January | 8,000 |
| Bala | February | 11,000 |
| Bala | March | 9,000 |
We want to transform the months into columns:
| SalesPerson | January | February | March |
|---|---|---|---|
| Arun | 10,000 | 12,000 | 15,000 |
| Bala | 8,000 | 11,000 | 9,000 |
2. Create sample data
CREATE TABLE Sales
(
    SalesId     INT PRIMARY KEY,
    SalesPerson VARCHAR(50),
    SalesMonth  VARCHAR(20),
    Amount      DECIMAL(10,2)
);
INSERT INTO Sales
(
SalesId,
SalesPerson,
SalesMonth,
Amount
)
VALUES
(1, 'Arun', 'January', 10000),
(2, 'Arun', 'February', 12000),
(3, 'Arun', 'March', 15000),
(4, 'Bala', 'January', 8000),
(5, 'Bala', 'February', 11000),
(6, 'Bala', 'March', 9000),
(7, 'Chitra', 'January', 7000),
(8, 'Chitra', 'March', 13000);View the data:
SELECT
    SalesPerson,
    SalesMonth,
    Amount
FROM Sales
ORDER BY SalesPerson, SalesId;
Result:
| SalesPerson | SalesMonth | Amount |
|---|---|---|
| Arun | January | 10,000 |
| Arun | February | 12,000 |
| Arun | March | 15,000 |
| Bala | January | 8,000 |
| Bala | February | 11,000 |
| Bala | March | 9,000 |
| Chitra | January | 7,000 |
| Chitra | March | 13,000 |
Chitra does not have a February sale.
3. Basic PIVOT syntax
SELECT column-list
FROM
(
    SourceQuery
) AS SourceData
PIVOT
(
    AggregateFunction(ValueColumn)
    FOR PivotColumn IN
    (
        [ColumnValue1],
        [ColumnValue2],
        [ColumnValue3]
    )
) AS PivotTable;
The important parts are:
| Part | Purpose |
|---|---|
| Source query | Supplies the original rows |
| Value column | Contains values to calculate |
| Pivot column | Contains values that become column names |
| Aggregate function | Combines multiple matching rows |
IN list |
Specifies the required output columns |
4. Basic PIVOT example
SELECT
    SalesPerson,
    [January],
    [February],
    [March]
FROM
(
    SELECT
        SalesPerson,
        SalesMonth,
        Amount
    FROM Sales
) AS SourceData
PIVOT
(
    SUM(Amount)
    FOR SalesMonth IN
    (
        [January],
        [February],
        [March]
    )
) AS PivotResult
ORDER BY SalesPerson;
Result:
| SalesPerson | January | February | March |
|---|---|---|---|
| Arun | 10,000 | 12,000 | 15,000 |
| Bala | 8,000 | 11,000 | 9,000 |
| Chitra | 7,000 | NULL |
13,000 |
How does it work?
Step 1: Source query
SELECT
    SalesPerson,
    SalesMonth,
    Amount
FROM Sales;
This provides three required elements:
-
SalesPerson— grouping column -
SalesMonth— values that become columns -
Amount— values that are aggregated
Step 2: Aggregate values
SUM(Amount)SQL Server adds the sales amount for each salesperson and month.
Step 3: Convert months into columns
FOR SalesMonth IN
(
    [January],
    [February],
    [March]
)
The values January, February and March become output column names.
5. Why is an aggregate function required?
PIVOT requires an aggregate function because more than one source row may belong to the same output cell.
Add another January sale for Arun:
INSERT INTO Sales
VALUES (9, 'Arun', 'January', 5000);
Arun now has two January records:
| SalesPerson | SalesMonth | Amount |
|---|---|---|
| Arun | January | 10,000 |
| Arun | January | 5,000 |
When SUM(Amount) is used, SQL Server combines them:
10,000 + 5,000 = 15,000Updated result:
| SalesPerson | January | February | March |
|---|---|---|---|
| Arun | 15,000 | 12,000 | 15,000 |
| Bala | 8,000 | 11,000 | 9,000 |
| Chitra | 7,000 | NULL |
13,000 |
6. Replace NULL with zero
If no matching record exists, PIVOT returns NULL.
Use ISNULL() or COALESCE() to display zero:
SELECT
    SalesPerson,
    ISNULL([January],  0) AS January,
    ISNULL([February], 0) AS February,
    ISNULL([March],    0) AS March
FROM
(
    SELECT
        SalesPerson,
        SalesMonth,
        Amount
    FROM Sales
) AS SourceData
PIVOT
(
    SUM(Amount)
    FOR SalesMonth IN
    (
        [January],
        [February],
        [March]
    )
) AS PivotResult
ORDER BY SalesPerson;
Result:
| SalesPerson | January | February | March |
|---|---|---|---|
| Arun | 15,000 | 12,000 | 15,000 |
| Bala | 8,000 | 11,000 | 9,000 |
| Chitra | 7,000 | 0 | 13,000 |
7. PIVOT using COUNT()
We can count the number of sales transactions in each month.
SELECT
    SalesPerson,
    [January],
    [February],
    [March]
FROM
(
    SELECT
        SalesPerson,
        SalesMonth,
        SalesId
    FROM Sales
) AS SourceData
PIVOT
(
    COUNT(SalesId)
    FOR SalesMonth IN
    (
        [January],
        [February],
        [March]
    )
) AS PivotResult
ORDER BY SalesPerson;
Result after adding Arun’s second January transaction:
| SalesPerson | January | February | March |
|---|---|---|---|
| Arun | 2 | 1 | 1 |
| Bala | 1 | 1 | 1 |
| Chitra | 1 | 0 | 1 |
This counts transactions; it does not total the sales amount.
8. PIVOT using AVG()
SELECT
    SalesPerson,
    [January],
    [February],
    [March]
FROM
(
    SELECT
        SalesPerson,
        SalesMonth,
        Amount
    FROM Sales
) AS SourceData
PIVOT
(
    AVG(Amount)
    FOR SalesMonth IN
    (
        [January],
        [February],
        [March]
    )
) AS PivotResult
ORDER BY SalesPerson;
Result:
| SalesPerson | January | February | March |
|---|---|---|---|
| Arun | 7,500 | 12,000 | 15,000 |
| Bala | 8,000 | 11,000 | 9,000 |
| Chitra | 7,000 | NULL |
13,000 |
Arun’s January average is:
(10,000 + 5,000) / 2 = 7,5009. Important source-query rule
Only select the required columns in the source query.
Correct:
SELECT
    SalesPerson,
    SalesMonth,
    Amount
FROM Sales
Potentially incorrect:
SELECT *
FROM Sales
Why?
SalesId is unique. If it is included, SQL Server may treat it as an additional grouping column and produce unexpected rows.
The source query should normally contain only:
-
Grouping columns
-
Pivot column
-
Aggregate value column
10. PIVOT with multiple grouping columns
Create regional sales data:
CREATE TABLE RegionalSales
(
    SalesId     INT PRIMARY KEY,
    Region      VARCHAR(20),
    SalesPerson VARCHAR(50),
    SalesMonth  VARCHAR(20),
    Amount      DECIMAL(10,2)
);
INSERT INTO RegionalSales
VALUES
(1, 'South', 'Arun', 'January', 10000),
(2, 'South', 'Arun', 'February', 12000),
(3, 'South', 'Bala', 'January', 8000),
(4, 'South', 'Bala', 'February', 11000),
(5, 'North', 'Chitra','January', 9000),
(6, 'North', 'Chitra','February', 14000);Query:
SELECT
    Region,
    SalesPerson,
    [January],
    [February]
FROM
(
    SELECT
        Region,
        SalesPerson,
        SalesMonth,
        Amount
    FROM RegionalSales
) AS SourceData
PIVOT
(
    SUM(Amount)
    FOR SalesMonth IN
    (
        [January],
        [February]
    )
) AS PivotResult
ORDER BY Region, SalesPerson;
Result:
| Region | SalesPerson | January | February |
|---|---|---|---|
| North | Chitra | 9,000 | 14,000 |
| South | Arun | 10,000 | 12,000 |
| South | Bala | 8,000 | 11,000 |
Both Region and SalesPerson become grouping columns.
11. Static PIVOT
The previous examples are called static pivots because the output columns are manually specified:
IN
(
    [January],
    [February],
    [March]
)
Limitation
If a new month such as April is inserted, it will not automatically appear.
INSERT INTO Sales
VALUES (10, 'Arun', 'April', 18000);
The pivot query continues to show only:
January, February, MarchTo display April, change the query:
IN
(
    [January],
    [February],
    [March],
    [April]
)
Static PIVOT is suitable when the output columns are known and fixed.
12. Dynamic PIVOT
A dynamic pivot generates the column list automatically from the data.
DECLARE @Columns NVARCHAR(MAX);
DECLARE @Sql     NVARCHAR(MAX);
Generate the month columns:
SELECT @Columns =
    STRING_AGG(QUOTENAME(SalesMonth), ',')
FROM
(
    SELECT DISTINCT SalesMonth
    FROM Sales
) AS Months;
Build the pivot query:
SET @Sql = N'
SELECT
    SalesPerson,
    ' + @Columns + N'
FROM
(
    SELECT
        SalesPerson,
        SalesMonth,
        Amount
    FROM Sales
) AS SourceData
PIVOT
(
    SUM(Amount)
    FOR SalesMonth IN
    (
        ' + @Columns + N'
    )
) AS PivotResult
ORDER BY SalesPerson;';
Execute it:
EXEC sys.sp_executesql @Sql;Possible result:
| SalesPerson | April | February | January | March |
|---|---|---|---|---|
| Arun | 18,000 | 12,000 | 15,000 | 15,000 |
| Bala | NULL |
11,000 | 8,000 | 9,000 |
| Chitra | NULL |
NULL |
7,000 | 13,000 |
Why use QUOTENAME()?
QUOTENAME(SalesMonth)It converts:
Januaryinto:
[January]This creates a valid delimited SQL identifier and helps protect the dynamically generated column list.
For values coming from users, dynamic SQL must still be handled carefully and parameterized wherever values—not identifiers—are involved.
13. Dynamic pivot with correct month order
STRING_AGG() may place text month names alphabetically. Use a month number when chronological order matters.
Example source data should ideally store:
MonthNumber = 1
MonthName   = January
Then generate columns in month-number order:
SELECT @Columns =
    STRING_AGG(QUOTENAME(SalesMonth), ',')
        WITHIN GROUP (ORDER BY MonthNumber)
FROM
(
    SELECT DISTINCT
        SalesMonth,
        MonthNumber
    FROM SalesWithMonthNumber
) AS Months;
This produces:
[January],[February],[March],[April]Store actual dates or month numbers instead of depending only on text month names.
14. Conditional aggregation as an alternative
PIVOT can also be written using CASE expressions:
SELECT
    SalesPerson,

    SUM
    (
        CASE
            WHEN SalesMonth = 'January'
            THEN Amount
        END
    ) AS January,

    SUM
    (
        CASE
            WHEN SalesMonth = 'February'
            THEN Amount
        END
    ) AS February,

    SUM
    (
        CASE
            WHEN SalesMonth = 'March'
            THEN Amount
        END
    ) AS March

FROM Sales
GROUP BY SalesPerson
ORDER BY SalesPerson;
Result:
| SalesPerson | January | February | March |
|---|---|---|---|
| Arun | 15,000 | 12,000 | 15,000 |
| Bala | 8,000 | 11,000 | 9,000 |
| Chitra | 7,000 | NULL |
13,000 |
PIVOT versus conditional aggregation
PIVOT |
Conditional aggregation |
|---|---|
| Concise for simple cross-tab reports | Often more flexible |
Uses special PIVOT syntax |
Uses CASE and GROUP BY |
| Supports one aggregate directly | Easier to use multiple aggregates |
| Dynamic columns require dynamic SQL | Dynamic columns also require dynamic SQL |
Conditional aggregation is often preferred when the report requires several calculations.
For example:
SELECT
    SalesPerson,
    SUM(CASE WHEN SalesMonth = 'January' THEN Amount END)
        AS JanuaryTotal,
    COUNT(CASE WHEN SalesMonth = 'January' THEN 1 END)
        AS JanuaryCount
FROM Sales
GROUP BY SalesPerson;
15. UNPIVOT
What is UNPIVOT?
UNPIVOT converts multiple columns into rows.
Suppose data is stored in this wide format:
| SalesPerson | January | February | March |
|---|---|---|---|
| Arun | 10,000 | 12,000 | 15,000 |
| Bala | 8,000 | 11,000 | 9,000 |
| Chitra | 7,000 | NULL |
13,000 |
UNPIVOT transforms it into:
| SalesPerson | SalesMonth | Amount |
|---|---|---|
| Arun | January | 10,000 |
| Arun | February | 12,000 |
| Arun | March | 15,000 |
| Bala | January | 8,000 |
| Bala | February | 11,000 |
| Bala | March | 9,000 |
| Chitra | January | 7,000 |
| Chitra | March | 13,000 |
16. Create sample table for UNPIVOT
CREATE TABLE SalesSummary
(
    SalesPerson VARCHAR(50),
    January     DECIMAL(10,2),
    February    DECIMAL(10,2),
    March       DECIMAL(10,2)
);
INSERT INTO SalesSummary
VALUES
('Arun', 10000, 12000, 15000),
('Bala', 8000, 11000, 9000),
('Chitra', 7000, NULL, 13000);View the data:
SELECT *
FROM SalesSummary;
Result:
| SalesPerson | January | February | March |
|---|---|---|---|
| Arun | 10,000 | 12,000 | 15,000 |
| Bala | 8,000 | 11,000 | 9,000 |
| Chitra | 7,000 | NULL |
13,000 |
17. Basic UNPIVOT syntax
SELECT column-list
FROM SourceTable
UNPIVOT
(
    ValueColumn
    FOR NameColumn IN
    (
        SourceColumn1,
        SourceColumn2,
        SourceColumn3
    )
) AS UnpivotTable;
18. Basic UNPIVOT example
SELECT
    SalesPerson,
    SalesMonth,
    Amount
FROM SalesSummary
UNPIVOT
(
    Amount
    FOR SalesMonth IN
    (
        January,
        February,
        March
    )
) AS UnpivotResult
ORDER BY SalesPerson,
    CASE SalesMonth
        WHEN 'January'  THEN 1
        WHEN 'February' THEN 2
        WHEN 'March'    THEN 3
    END;
Result:
| SalesPerson | SalesMonth | Amount |
|---|---|---|
| Arun | January | 10,000 |
| Arun | February | 12,000 |
| Arun | March | 15,000 |
| Bala | January | 8,000 |
| Bala | February | 11,000 |
| Bala | March | 9,000 |
| Chitra | January | 7,000 |
| Chitra | March | 13,000 |
Notice that Chitra’s February row is missing.
19. How does UNPIVOT work?
Consider:
UNPIVOT
(
    Amount
    FOR SalesMonth IN
    (
        January,
        February,
        March
    )
)| Element | Meaning |
|---|---|
Amount |
New column containing the original values |
SalesMonth |
New column containing original column names |
January, February, March |
Columns that are converted into rows |
For Arun:
January  = 10000
February = 12000
March    = 15000
Becomes:
Arun | January  | 10000
Arun | February | 12000
Arun | March    | 15000
20. Important NULL behavior
UNPIVOT automatically removes rows whose source value is NULL.
Original data:
Chitra | February | NULLAfter UNPIVOT, no February row is returned for Chitra.
If NULL must be preserved as zero, replace it before unpivoting:
SELECT
    SalesPerson,
    SalesMonth,
    Amount
FROM
(
    SELECT
        SalesPerson,
        ISNULL(January,  0) AS January,
        ISNULL(February, 0) AS February,
        ISNULL(March,    0) AS March
    FROM SalesSummary
) AS SourceData
UNPIVOT
(
    Amount
    FOR SalesMonth IN
    (
        January,
        February,
        March
    )
) AS UnpivotResult
ORDER BY SalesPerson, SalesMonth;
Result now includes:
| SalesPerson | SalesMonth | Amount |
|---|---|---|
| Chitra | February | 0 |
Be careful: replacing NULL with zero changes its meaning. NULL may mean “unknown” or “not available,” whereas zero means an actual value of zero.
21. CROSS APPLY as an UNPIVOT alternative
Another flexible method is CROSS APPLY with VALUES:
SELECT
    S.SalesPerson,
    U.SalesMonth,
    U.Amount
FROM SalesSummary AS S
CROSS APPLY
(
    VALUES
        ('January',  S.January),
        ('February', S.February),
        ('March',    S.March)
) AS U(SalesMonth, Amount)
WHERE U.Amount IS NOT NULL
ORDER BY S.SalesPerson,
    CASE U.SalesMonth
        WHEN 'January'  THEN 1
        WHEN 'February' THEN 2
        WHEN 'March'    THEN 3
    END;
Result:
| SalesPerson | SalesMonth | Amount |
|---|---|---|
| Arun | January | 10,000 |
| Arun | February | 12,000 |
| Arun | March | 15,000 |
| Bala | January | 8,000 |
| Bala | February | 11,000 |
| Bala | March | 9,000 |
| Chitra | January | 7,000 |
| Chitra | March | 13,000 |
This approach is often easier when:
-
Column names must be renamed
-
Multiple values must be unpivoted together
-
Additional calculations are required
-
More control over
NULLhandling is needed
22. Does UNPIVOT exactly reverse PIVOT?
Not always.
PIVOT may aggregate multiple source rows into a single value:
Arun | January | 10000
Arun | January | 5000
After PIVOT with SUM():
Arun | January | 15000After unpivoting, SQL Server returns:
Arun | January | 15000It cannot restore the original two records because that detail was lost during aggregation.
Therefore:
UNPIVOTchanges columns into rows, but it cannot recover details that were removed byPIVOTaggregation.
23. Complete PIVOT and UNPIVOT cycle
Original row-based data
| SalesPerson | SalesMonth | Amount |
|---|---|---|
| Arun | January | 10,000 |
| Arun | February | 12,000 |
| Arun | March | 15,000 |
After PIVOT
SELECT
    SalesPerson,
    [January],
    [February],
    [March]
FROM
(
    SELECT
        SalesPerson,
        SalesMonth,
        Amount
    FROM Sales
    WHERE SalesPerson = 'Arun'
      AND SalesId IN (1, 2, 3)
) AS SourceData
PIVOT
(
    SUM(Amount)
    FOR SalesMonth IN
    (
        [January],
        [February],
        [March]
    )
) AS PivotResult;
Result:
| SalesPerson | January | February | March |
|---|---|---|---|
| Arun | 10,000 | 12,000 | 15,000 |
After UNPIVOT
SELECT
    SalesPerson,
    SalesMonth,
    Amount
FROM
(
    SELECT
        SalesPerson,
        [January],
        [February],
        [March]
    FROM
    (
        SELECT
            SalesPerson,
            SalesMonth,
            Amount
        FROM Sales
        WHERE SalesPerson = 'Arun'
          AND SalesId IN (1, 2, 3)
    ) AS SourceData
    PIVOT
    (
        SUM(Amount)
        FOR SalesMonth IN
        (
            [January],
            [February],
            [March]
        )
    ) AS P
) AS PivotedData
UNPIVOT
(
    Amount
    FOR SalesMonth IN
    (
        [January],
        [February],
        [March]
    )
) AS U;
Result:
| SalesPerson | SalesMonth | Amount |
|---|---|---|
| Arun | January | 10,000 |
| Arun | February | 12,000 |
| Arun | March | 15,000 |
24. PIVOT versus UNPIVOT
| Feature | PIVOT |
UNPIVOT |
|---|---|---|
| Conversion | Rows to columns | Columns to rows |
| Primary purpose | Cross-tab reports | Normalize wide report data |
| Requires aggregate | Yes | No |
| Handles duplicate records | Combines them using aggregation | Not applicable |
NULL behavior |
Missing combinations become NULL |
Source NULL values are removed |
| Typical use | Monthly sales report | Convert monthly columns into records |
25. Performance considerations
-
Filter unnecessary rows before applying
PIVOT. -
Select only the required source columns.
-
Avoid repeatedly applying
PIVOTandUNPIVOTin the same query. -
Index columns used for filtering, grouping and joining.
-
Dynamic pivot requires dynamic SQL and should be constructed safely.
-
Use
QUOTENAME()for dynamically generated identifiers. -
Consider conditional aggregation for complex reports.
-
Very wide pivot output can consume significant memory.
-
Pivoted tables are normally useful for reporting, not transactional data storage.
Key interview points
-
PIVOTconverts unique row values into columns. -
UNPIVOTconverts multiple columns into rows. -
PIVOTrequires an aggregate function. -
The
INlist controls which pivoted columns are returned. -
Static pivot columns are fixed in the query.
-
Dynamic pivot columns are constructed using dynamic SQL.
-
Select only required columns in the pivot source query.
-
Missing pivot combinations produce
NULL. -
UNPIVOTremoves source values that areNULL. -
UNPIVOTcannot recover records lost through pivot aggregation. -
Conditional aggregation is a flexible alternative to
PIVOT. -
CROSS APPLYwithVALUESis a flexible alternative toUNPIVOT.