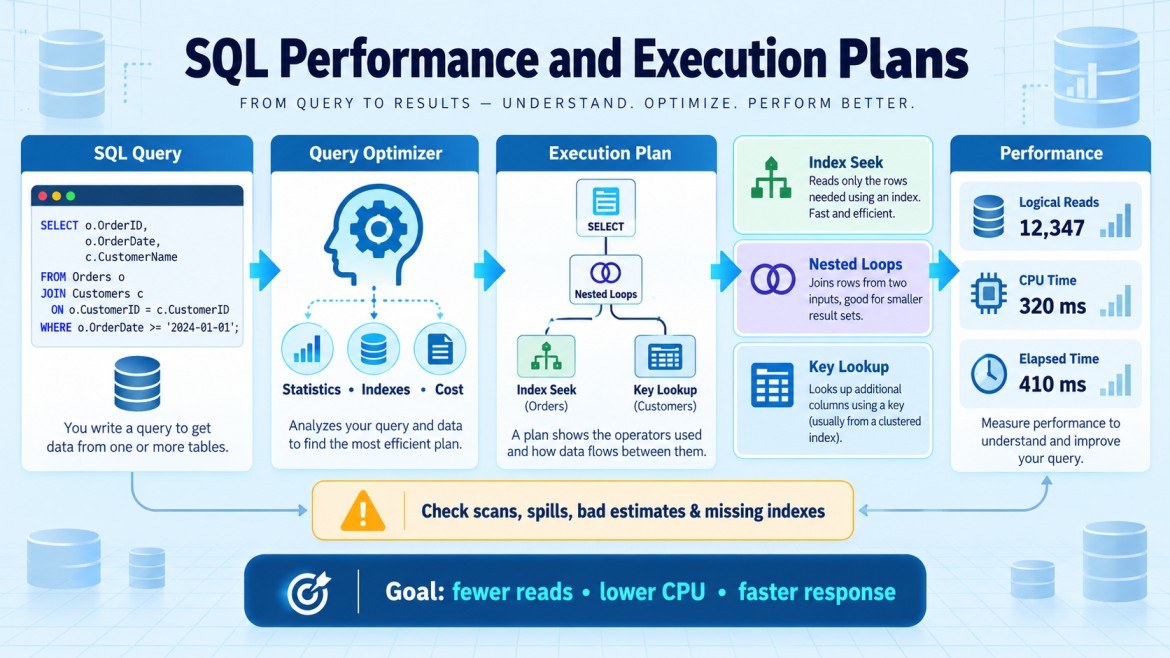


Query Cost, CPU Time, Elapsed Time and Logical Reads
| Metric | Meaning |
|---|---|
| Query Cost | The optimizer’s estimated amount of work for a query. It is mainly used to compare alternative plans, not as actual execution time. |
| CPU Time | Total processor time used to execute the query. |
| Elapsed Time | Total clock time from the query’s start to completion, including CPU work and waiting time. |
| Logical Reads | Number of 8-KB data pages read from SQL Server’s memory or buffer cache. Lower reads usually indicate a more efficient query. |
Example
SET STATISTICS IO ON;
SET STATISTICS TIME ON;

SELECT *
FROM Orders
WHERE CustomerId = 100;
The Messages tab shows CPU time, elapsed time and logical reads.
How to understand the results
-
High CPU time: Expensive calculations, joins, sorting or processing many rows.
-
Elapsed time much higher than CPU time: The query may be waiting for blocking, disk I/O, memory or another resource.
-
High logical reads: SQL Server is reading too many pages; check indexes and query conditions.
-
High estimated cost: The optimizer expects the operator or query to require more resources than alternatives.
Key points
-
Query cost is an estimate, not milliseconds or actual runtime.
-
Logical reads are often more consistent than elapsed time when comparing query changes.
-
For parallel queries, total CPU time can be greater than elapsed time.
-
Compare queries under similar data, cache and server-load conditions.